Description
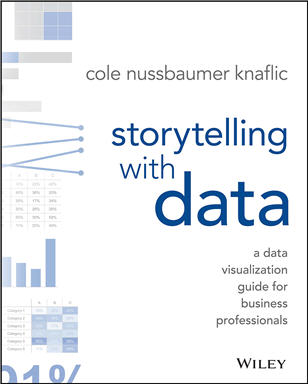
Storytelling with Data: A Data Visualization Guide for Business Professionals, ISBN-13: 978-1119002253
[PDF eBook eTextbook] – Available Instantly
- Publisher: Wiley
- Publication date: November 2, 2015
- Edition: 1st
- Language: English
- 288 pages
- ISBN-10: 1119002257
- ISBN-13: 978-1119002253
Don’t simply show your data—tell a story with it! Storytelling with Data teaches you the fundamentals of data visualization and how to communicate effectively with data. You’ll discover the power of storytelling and the way to make data a pivotal point in your story. The lessons in this illuminative text are grounded in theory, but made accessible through numerous real-world examples—ready for immediate application to your next graph or presentation.
Storytelling is not an inherent skill, especially when it comes to data visualization, and the tools at our disposal don’t make it any easier. This book demonstrates how to go beyond conventional tools to reach the root of your data, and how to use your data to create an engaging, informative, compelling story. Specifically, you’ll learn how to:
- Understand the importance of context and audience
- Determine the appropriate type of graph for your situation
- Recognize and eliminate the clutter clouding your information
- Direct your audience’s attention to the most important parts of your data
- Think like a designer and utilize concepts of design in data visualization
- Leverage the power of storytelling to help your message resonate with your audience
Together, the lessons in this book will help you turn your data into high impact visual stories that stick with your audience. Rid your world of ineffective graphs, one exploding 3D pie chart at a time. There is a story in your data—Storytelling with Data will give you the skills and power to tell it.
Table of Contents:
Foreword
Note
Acknowledgments
About the Author
Introduction
Bad graphs are everywhere
We aren’t naturally good at storytelling with data
Who this book is written for
How I learned to tell stories with data
How you’ll learn to tell stories with data: 6 lessons
Illustrative examples span many industries
Lessons are not tool specific
How this book is organized
Chapter 1 the importance of context
Exploratory vs. explanatory analysis
Who, what, and how
Who
What
How
Who, what, and how: illustrated by example
Consulting for context: questions to ask
The 3-minute story & Big Idea
Storyboarding
In closing
Chapter 2 choosing an effective visual
Simple text
Tables
Graphs
Points
Lines
Bars
Area
Other types of graphs
To be avoided
In closing
Chapter 3 clutter is your enemy!
Cognitive load
Clutter
Gestalt principles of visual perception
Lack of visual order
Non-strategic use of contrast
Decluttering: step-by-step
In closing
Chapter 4 focus your audience’s attention
You see with your brain
A brief lesson on memory
Preattentive attributes signal where to look
Size
Color
Position on page
In closing
Chapter 5 think like a designer
Affordances
Accessibility
Aesthetics
Acceptance
In closing
Chapter 6 dissecting model visuals
Model visual #1: line graph
Model visual #2: annotated line graph with forecast
Model visual #3: 100% stacked bars
Model visual #4: leveraging positive and negative stacked bars
Model visual #5: horizontal stacked bars
In closing
Chapter 7 lessons in storytelling
The magic of story
Constructing the story
The narrative structure
The power of repetition
Tactics to help ensure that your story is clear
In closing
Chapter 8 pulling it all together
Lesson 1: understand the context
Lesson 2: choose an appropriate display
Lesson 3: eliminate clutter
Lesson 4: draw attention where you want your audience to focus
Lesson 5: think like a designer
Lesson 6: tell a story
In closing
Chapter 9 case studies
CASE STUDY 1: Color considerations with a dark background
CASE STUDY 2: Leveraging animation in the visuals you present
CASE STUDY 3: Logic in order
CASE STUDY 4: Strategies for avoiding the spaghetti graph
CASE STUDY 5: Alternatives to pies
In closing
Chapter 10 final thoughts
Where to go from here
Building storytelling with data competency in your team or organization
Recap: a quick look at all we’ve learned
In closing
Bibliography
Index
EULA
For nearly a decade, Cole and team have delivered interactive learning sessions highly sought after by data-minded individuals, companies, and philanthropic organizations all over the world. They also help people create graphs that make sense and weave them into a compelling story through the popular SWD blog, podcast, monthly challenge, and live stream events and other resources. Learn more at storytellingwithdata.com.
What makes us different?
• Instant Download
• Always Competitive Pricing
• 100% Privacy
• FREE Sample Available
• 24-7 LIVE Customer Support


