Description
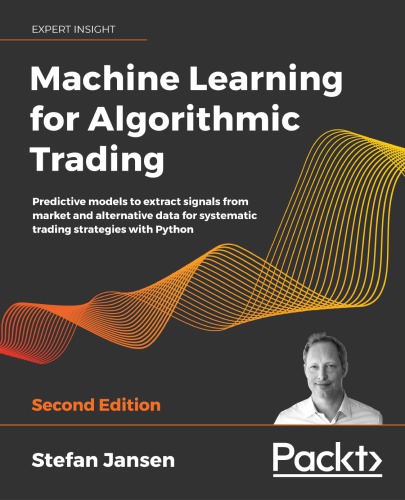
Machine Learning for Algorithmic Trading: Predictive models to extract signals from market and alternative data for systematic trading strategies with Python 2nd Edition by Stefan Jansen, ISBN-13: 978-1839217715
[PDF eBook eTextbook] – Available Instantly
- Publisher: Packt Publishing
- Publication date: July 31, 2020
- Edition: 2nd
- Language: English
- 820 pages
- ISBN-10: 1839217715
- ISBN-13: 978-1839217715
Leverage machine learning to design and back-test automated trading strategies for real-world markets using pandas, TA-Lib, scikit-learn, LightGBM, SpaCy, Gensim, TensorFlow 2, Zipline, backtrader, Alphalens, and pyfolio.
Purchase of the print or Kindle book includes a free eBook in the PDF format.
Key Features
- Design, train, and evaluate machine learning algorithms that underpin automated trading strategies
- Create a research and strategy development process to apply predictive modeling to trading decisions
- Leverage NLP and deep learning to extract tradeable signals from market and alternative data
Book Description
The explosive growth of digital data has boosted the demand for expertise in trading strategies that use machine learning (ML). This revised and expanded second edition enables you to build and evaluate sophisticated supervised, unsupervised, and reinforcement learning models.
This book introduces end-to-end machine learning for the trading workflow, from the idea and feature engineering to model optimization, strategy design, and backtesting. It illustrates this by using examples ranging from linear models and tree-based ensembles to deep-learning techniques from cutting edge research.
This edition shows how to work with market, fundamental, and alternative data, such as tick data, minute and daily bars, SEC filings, earnings call transcripts, financial news, or satellite images to generate tradeable signals. It illustrates how to engineer financial features or alpha factors that enable an ML model to predict returns from price data for US and international stocks and ETFs. It also shows how to assess the signal content of new features using Alphalens and SHAP values and includes a new appendix with over one hundred alpha factor examples.
By the end, you will be proficient in translating ML model predictions into a trading strategy that operates at daily or intraday horizons, and in evaluating its performance.
What you will learn
- Leverage market, fundamental, and alternative text and image data
- Research and evaluate alpha factors using statistics, Alphalens, and SHAP values
- Implement machine learning techniques to solve investment and trading problems
- Backtest and evaluate trading strategies based on machine learning using Zipline and Backtrader
- Optimize portfolio risk and performance analysis using pandas, NumPy, and pyfolio
- Create a pairs trading strategy based on cointegration for US equities and ETFs
- Train a gradient boosting model to predict intraday returns using AlgoSeek’s high-quality trades and quotes data
Who this book is for
If you are a data analyst, data scientist, Python developer, investment analyst, or portfolio manager interested in getting hands-on machine learning knowledge for trading, this book is for you. This book is for you if you want to learn how to extract value from a diverse set of data sources using machine learning to design your own systematic trading strategies.
Some understanding of Python and machine learning techniques is required.
Table of Contents:
Preface
What to expect
What’s new in the second edition
Who should read this book
What this book covers
To get the most out of this book
Get in touch
Machine Learning for Trading – From Idea to Execution
The rise of ML in the investment industry
From electronic to high-frequency trading
Factor investing and smart beta funds
Algorithmic pioneers outperform humans
ML-driven funds attract $1 trillion in AUM
The emergence of quantamental funds
Investments in strategic capabilities
ML and alternative data
Crowdsourcing trading algorithms
Designing and executing an ML-driven strategy
Sourcing and managing data
From alpha factor research to portfolio management
The research phase
The execution phase
Strategy backtesting
ML for trading – strategies and use cases
The evolution of algorithmic strategies
Use cases of ML for trading
Data mining for feature extraction and insights
Supervised learning for alpha factor creation
Asset allocation
Testing trade ideas
Reinforcement learning
Summary
Market and Fundamental Data – Sources and Techniques
Market data reflects its environment
Market microstructure – the nuts and bolts
How to trade – different types of orders
Where to trade – from exchanges to dark pools
Working with high-frequency data
How to work with Nasdaq order book data
Communicating trades with the FIX protocol
The Nasdaq TotalView-ITCH data feed
How to parse binary order messages
Summarizing the trading activity for all 8,500 stocks
How to reconstruct all trades and the order book
From ticks to bars – how to regularize market data
The raw material – tick bars
Plain-vanilla denoising – time bars
Accounting for order fragmentation – volume bars
Accounting for price changes – dollar bars
AlgoSeek minute bars – equity quote and trade data
From the consolidated feed to minute bars
Quote and trade data fields
How to process AlgoSeek intraday data
API access to market data
Remote data access using pandas
Reading HTML tables
pandas-datareader for market data
yfinance – scraping data from Yahoo! Finance
How to download end-of-day and intraday prices
How to download the option chain and prices
Quantopian
Zipline
Quandl
Other market data providers
How to work with fundamental data
Financial statement data
Automated processing – XBRL
Building a fundamental data time series
Other fundamental data sources
pandas-datareader – macro and industry data
Efficient data storage with pandas
Summary
Alternative Data for Finance – Categories and Use Cases
The alternative data revolution
Sources of alternative data
Individuals
Business processes
Sensors
Satellites
Geolocation data
Criteria for evaluating alternative data
Quality of the signal content
Asset classes
Investment style
Risk premiums
Alpha content and quality
Quality of the data
Legal and reputational risks
Exclusivity
Time horizon
Frequency
Reliability
Technical aspects
Latency
Format
The market for alternative data
Data providers and use cases
Social sentiment data
Satellite data
Geolocation data
Email receipt data
Working with alternative data
Scraping OpenTable data
Parsing data from HTML with Requests and BeautifulSoup
Introducing Selenium – using browser automation
Building a dataset of restaurant bookings and ratings
Taking automation one step further with Scrapy and Splash
Scraping and parsing earnings call transcripts
Summary
Financial Feature Engineering – How to Research Alpha Factors
Alpha factors in practice – from data to signals
Building on decades of factor research
Momentum and sentiment – the trend is your friend
Why might momentum and sentiment drive excess returns?
How to measure momentum and sentiment
Value factors – hunting fundamental bargains
Relative value strategies
Why do value factors help predict returns?
How to capture value effects
Volatility and size anomalies
Why do volatility and size predict returns?
How to measure volatility and size
Quality factors for quantitative investing
Why quality matters
How to measure asset quality
Engineering alpha factors that predict returns
How to engineer factors using pandas and NumPy
Loading, slicing, and reshaping the data
Resampling – from daily to monthly frequency
How to compute returns for multiple historical periods
Using lagged returns and different holding periods
Computing factor betas
How to add momentum factors
Adding time indicators to capture seasonal effects
How to create lagged return features
How to create forward returns
How to use TA-Lib to create technical alpha factors
Denoising alpha factors with the Kalman filter
How does the Kalman filter work?
How to apply a Kalman filter using pykalman
How to preprocess your noisy signals using wavelets
From signals to trades – Zipline for backtests
How to backtest a single-factor strategy
A single alpha factor from market data
Built-in Quantopian factors
Combining factors from diverse data sources
Separating signal from noise with Alphalens
Creating forward returns and factor quantiles
Predictive performance by factor quantiles
The information coefficient
Factor turnover
Alpha factor resources
Alternative algorithmic trading libraries
Summary
Portfolio Optimization and Performance Evaluation
How to measure portfolio performance
Capturing risk-return trade-offs in a single number
The Sharpe ratio
The information ratio
The fundamental law of active management
How to manage portfolio risk and return
The evolution of modern portfolio management
Mean-variance optimization
How it works
Finding the efficient frontier in Python
Challenges and shortcomings
Alternatives to mean-variance optimization
The 1/N portfolio
The minimum-variance portfolio
Global Portfolio Optimization – the Black-Litterman approach
How to size your bets – the Kelly criterion
Optimal investment – multiple assets
Risk parity
Risk factor investment
Hierarchical risk parity
Trading and managing portfolios with Zipline
Scheduling signal generation and trade execution
Implementing mean-variance portfolio optimization
Measuring backtest performance with pyfolio
Creating the returns and benchmark inputs
Getting pyfolio input from Alphalens
Getting pyfolio input from a Zipline backtest
Walk-forward testing – out-of-sample returns
Summary performance statistics
Drawdown periods and factor exposure
Modeling event risk
Summary
The Machine Learning Process
How machine learning from data works
The challenge – matching the algorithm to the task
Supervised learning – teaching by example
Unsupervised learning – uncovering useful patterns
Use cases – from risk management to text processing
Cluster algorithms – seeking similar observations
Dimensionality reduction – compressing information
Reinforcement learning – learning by trial and error
The machine learning workflow
Basic walkthrough – k-nearest neighbors
Framing the problem – from goals to metrics
Prediction versus inference
Regression – popular loss functions and error metrics
Classification – making sense of the confusion matrix
Collecting and preparing the data
Exploring, extracting, and engineering features
Using information theory to evaluate features
Selecting an ML algorithm
Design and tune the model
The bias-variance trade-off
Underfitting versus overfitting – a visual example
How to manage the bias-variance trade-off
Learning curves
How to select a model using cross-validation
How to implement cross-validation in Python
KFold iterator
Leave-one-out CV
Leave-P-Out CV
ShuffleSplit
Challenges with cross-validation in finance
Time series cross-validation with scikit-learn
Purging, embargoing, and combinatorial CV
Parameter tuning with scikit-learn and Yellowbrick
Validation curves – plotting the impact of hyperparameters
Learning curves – diagnosing the bias-variance trade-off
Parameter tuning using GridSearchCV and pipeline
Summary
Linear Models – From Risk Factors to Return Forecasts
From inference to prediction
The baseline model – multiple linear regression
How to formulate the model
How to train the model
Ordinary least squares – how to fit a hyperplane to the data
Maximum likelihood estimation
Gradient descent
The Gauss–Markov theorem
How to conduct statistical inference
How to diagnose and remedy problems
Goodness of fit
Heteroskedasticity
Serial correlation
Multicollinearity
How to run linear regression in practice
OLS with statsmodels
Stochastic gradient descent with sklearn
How to build a linear factor model
From the CAPM to the Fama–French factor models
Obtaining the risk factors
Fama–Macbeth regression
Regularizing linear regression using shrinkage
How to hedge against overfitting
How ridge regression works
How lasso regression works
How to predict returns with linear regression
Preparing model features and forward returns
Creating the investment universe
Selecting and computing alpha factors using TA-Lib
Adding lagged returns
Generating target forward returns
Dummy encoding of categorical variables
Linear OLS regression using statsmodels
Selecting the relevant universe
Estimating the vanilla OLS regression
Diagnostic statistics
Linear regression using scikit-learn
Selecting features and targets
Cross-validating the model
Evaluating the results – information coefficient and RMSE
Ridge regression using scikit-learn
Tuning the regularization parameters using cross-validation
Cross-validation results and ridge coefficient paths
Top 10 coefficients
Lasso regression using sklearn
Cross-validating the lasso model
Evaluating the results – IC and lasso path
Comparing the quality of the predictive signals
Linear classification
The logistic regression model
The objective function
The logistic function
Maximum likelihood estimation
How to conduct inference with statsmodels
Predicting price movements with logistic regression
How to convert a regression into a classification problem
Cross-validating the logistic regression hyperparameters
Evaluating the results using AUC and IC
Summary
The ML4T Workflow – From Model to Strategy Backtesting
How to backtest an ML-driven strategy
Backtesting pitfalls and how to avoid them
Getting the data right
Look-ahead bias – use only point-in-time data
Survivorship bias – track your historical universe
Outlier control – do not exclude realistic extremes
Sample period – try to represent relevant future scenarios
Getting the simulation right
Mark-to-market performance – track risks over time
Transaction costs – assume a realistic trading environment
Timing of decisions – properly sequence signals and trades
Getting the statistics right
The minimum backtest length and the deflated SR
Optimal stopping for backtests
How a backtesting engine works
Vectorized versus event-driven backtesting
Key implementation aspects
Data ingestion – format, frequency, and timing
Factor engineering – built-in factors versus libraries
ML models, predictions, and signals
Trading rules and execution
Performance evaluation
backtrader – a flexible tool for local backtests
Key concepts of backtrader’s Cerebro architecture
Data feeds, lines, and indicators
From data and signals to trades – strategy
Commissions instead of commission schemes
Making it all happen – Cerebro
How to use backtrader in practice
How to load price and other data
How to formulate the trading logic
How to configure the Cerebro instance
backtrader summary and next steps
Zipline – scalable backtesting by Quantopian
Calendars and the Pipeline for robust simulations
Bundles – point-in-time data with on-the-fly adjustments
The Algorithm API – backtests on a schedule
Known issues
Ingesting your own bundles with minute data
Getting your data ready to be bundled
Writing your custom bundle ingest function
Registering your bundle
Creating and registering a custom TradingCalendar
The Pipeline API – backtesting an ML signal
Enabling the DataFrameLoader for our Pipeline
Creating a pipeline with a custom ML factor
How to train a model during the backtest
Preparing the features – how to define pipeline factors
How to design a custom ML factor
Tracking model performance during a backtest
Instead of how to use
Summary
Time-Series Models for Volatility Forecasts and Statistical Arbitrage
Tools for diagnostics and feature extraction
How to decompose time-series patterns
Rolling window statistics and moving averages
How to measure autocorrelation
How to diagnose and achieve stationarity
Transforming a time series to achieve stationarity
Handling instead of how to handle
On unit roots and random walks
How to diagnose a unit root
How to remove unit roots and work with the resulting series
Time-series transformations in practice
Univariate time-series models
How to build autoregressive models
How to identify the number of lags
How to diagnose model fit
How to build moving-average models
How to identify the number of lags
The relationship between the AR and MA models
How to build ARIMA models and extensions
How to model differenced series
How to identify the number of AR and MA terms
Adding features – ARMAX
Adding seasonal differencing – SARIMAX
How to forecast macro fundamentals
How to use time-series models to forecast volatility
The ARCH model
Generalizing ARCH – the GARCH model
How to build a model that forecasts volatility
Multivariate time-series models
Systems of equations
The vector autoregressive (VAR) model
Using the VAR model for macro forecasts
Cointegration – time series with a shared trend
The Engle-Granger two-step method
The Johansen likelihood-ratio test
Statistical arbitrage with cointegration
How to select and trade comoving asset pairs
Pairs trading in practice
Distance-based heuristics to find cointegrated pairs
How well do the heuristics predict significant cointegration?
Preparing the strategy backtest
Precomputing the cointegration tests
Getting entry and exit trades
Backtesting the strategy using backtrader
Tracking pairs with a custom DataClass
Running and evaluating the strategy
Extensions – how to do better
Summary
Bayesian ML – Dynamic Sharpe Ratios and Pairs Trading
How Bayesian machine learning works
How to update assumptions from empirical evidence
Exact inference – maximum a posteriori estimation
How to select priors
How to keep inference simple – conjugate priors
Dynamic probability estimates of asset price moves
Deterministic and stochastic approximate inference
Markov chain MonteCarlo sampling
Variational inference and automatic differentiation
Probabilistic programming with PyMC3
Bayesian machine learning with Theano
The PyMC3 workflow – predicting a recession
The data – leading recession indicators
Model definition – Bayesian logistic regression
Exact MAP inference
Approximate inference – MCMC
Approximate inference – variational Bayes
Model diagnostics
How to generate predictions
Summary and key takeaways
Bayesian ML for trading
Bayesian Sharpe ratio for performance comparison
Defining a custom probability model
Comparing the performance of two return series
Bayesian rolling regression for pairs trading
Stochastic volatility models
Summary
Random Forests – A Long-Short Strategy for Japanese Stocks
Decision trees – learning rules from data
How trees learn and apply decision rules
Decision trees in practice
The data – monthly stock returns and features
Building a regression tree with time-series data
Building a classification tree
Visualizing a decision tree
Evaluating decision tree predictions
Overfitting and regularization
How to regularize a decision tree
Decision tree pruning
Hyperparameter tuning
Using GridsearchCV with a custom metric
How to inspect the tree structure
Comparing regression and classification performance
Diagnosing training set size with learning curves
Gaining insight from feature importance
Strengths and weaknesses of decision trees
Random forests – making trees more reliable
Why ensemble models perform better
Bootstrap aggregation
How bagging lowers model variance
Bagged decision trees
How to build a random forest
How to train and tune a random forest
Feature importance for random forests
Out-of-bag testing
Pros and cons of random forests
Long-short signals for Japanese stocks
The data – Japanese equities
The features – lagged returns and technical indicators
The outcomes – forward returns for different horizons
The ML4T workflow with LightGBM
From universe selection to hyperparameter tuning
Sampling tickers to speed up cross-validation
Defining lookback, lookahead, and roll-forward periods
Hyperparameter tuning with LightGBM
Cross-validating signals over various horizons
Analyzing cross-validation performance
Ensembling forecasts – signal analysis using Alphalens
The strategy – backtest with Zipline
Ingesting Japanese Equities into Zipline
Running an in- and out-of-sample strategy backtest
The results – evaluation with pyfolio
Summary
Boosting Your Trading Strategy
Getting started – adaptive boosting
The AdaBoost algorithm
Using AdaBoost to predict monthly price moves
Gradient boosting – ensembles for most tasks
How to train and tune GBM models
Ensemble size and early stopping
Shrinkage and learning rate
Subsampling and stochastic gradient boosting
How to use gradient boosting with sklearn
How to tune parameters with GridSearchCV
Parameter impact on test scores
How to test on the holdout set
Using XGBoost, LightGBM, and CatBoost
How algorithmic innovations boost performance
Second-order loss function approximation
Simplified split-finding algorithms
Depth-wise versus leaf-wise growth
GPU-based training
DART – dropout for additive regression trees
Treatment of categorical features
Additional features and optimizations
A long-short trading strategy with boosting
Generating signals with LightGBM and CatBoost
From Python to C++ – creating binary data formats
How to tune hyperparameters
How to evaluate the results
Inside the black box – interpreting GBM results
Feature importance
Partial dependence plots
SHapley Additive exPlanations
Backtesting a strategy based on a boosting ensemble
Lessons learned and next steps
Boosting for an intraday strategy
Engineering features for high-frequency data
Minute-frequency signals with LightGBM
Evaluating the trading signal quality
Summary
Data-Driven Risk Factors and Asset Allocation with Unsupervised Learning
Dimensionality reduction
The curse of dimensionality
Linear dimensionality reduction
Principal component analysis
Independent component analysis
Manifold learning – nonlinear dimensionality reduction
t-distributed Stochastic Neighbor Embedding
Uniform Manifold Approximation and Projection
PCA for trading
Data-driven risk factors
Preparing the data – top 350 US stocks
Running PCA to identify the key return drivers
Eigenportfolios
Clustering
k-means clustering
Assigning observations to clusters
Evaluating cluster quality
Hierarchical clustering
Different strategies and dissimilarity measures
Visualization – dendrograms
Density-based clustering
DBSCAN
Hierarchical DBSCAN
Gaussian mixture models
Hierarchical clustering for optimal portfolios
How hierarchical risk parity works
Backtesting HRP using an ML trading strategy
Ensembling the gradient boosting model predictions
Using PyPortfolioOpt to compute HRP weights
Performance comparison with pyfolio
Summary
Text Data for Trading – Sentiment Analysis
ML with text data – from language to features
Key challenges of working with text data
The NLP workflow
Parsing and tokenizing text data – selecting the vocabulary
Linguistic annotation – relationships among tokens
Semantic annotation – from entities to knowledge graphs
Labeling – assigning outcomes for predictive modeling
Applications
From text to tokens – the NLP pipeline
NLP pipeline with spaCy and textacy
Parsing, tokenizing, and annotating a sentence
Batch-processing documents
Sentence boundary detection
Named entity recognition
N-grams
spaCy’s streaming API
Multi-language NLP
NLP with TextBlob
Stemming
Sentiment polarity and subjectivity
Counting tokens – the document-term matrix
The bag-of-words model
Creating the document-term matrix
Measuring the similarity of documents
Document-term matrix with scikit-learn
Using CountVectorizer
TfidfTransformer and TfidfVectorizer
Key lessons instead of lessons learned
NLP for trading
The naive Bayes classifier
Bayes’ theorem refresher
The conditional independence assumption
Classifying news articles
Sentiment analysis with Twitter and Yelp data
Binary sentiment classification with Twitter data
Multiclass sentiment analysis with Yelp business reviews
Summary
Topic Modeling – Summarizing Financial News
Learning latent topics – Goals and approaches
How to implement LSI using sklearn
Strengths and limitations
Probabilistic latent semantic analysis
How to implement pLSA using sklearn
Strengths and limitations
Latent Dirichlet allocation
How LDA works
The Dirichlet distribution
The generative model
Reverse engineering the process
How to evaluate LDA topics
Perplexity
Topic coherence
How to implement LDA using sklearn
How to visualize LDA results using pyLDAvis
How to implement LDA using Gensim
Modeling topics discussed in earnings calls
Data preprocessing
Model training and evaluation
Running experiments
Topic modeling for with financial news
Summary
Word Embeddings for Earnings Calls and SEC Filings
How word embeddings encode semantics
How neural language models learn usage in context
word2vec – scalable word and phrase embeddings
Model objective – simplifying the softmax
Automating phrase detection
Evaluating embeddings using semantic arithmetic
How to use pretrained word vectors
GloVe – Global vectors for word representation
Custom embeddings for financial news
Preprocessing – sentence detection and n-grams
The skip-gram architecture in TensorFlow 2
Noise-contrastive estimation – creating validation samples
Generating target-context word pairs
Creating the word2vec model layers
Visualizing embeddings using TensorBoard
How to train embeddings faster with Gensim
word2vec for trading with SEC filings
Preprocessing – sentence detection and n-grams
Automatic phrase detection
Labeling filings with returns to predict earnings surprises
Model training
Model evaluation
Performance impact of parameter settings
Sentiment analysis using doc2vec embeddings
Creating doc2vec input from Yelp sentiment data
Training a doc2vec model
Training a classifier with document vectors
Lessons learned and next steps
New frontiers – pretrained transformer models
Attention is all you need
BERT – towards a more universal language model
Key innovations – deeper attention and pretraining
Using pretrained state-of-the-art models
Trading on text data – lessons learned and next steps
Summary
Deep Learning for Trading
Deep learning – what’s new and why it matters
Hierarchical features tame high-dimensional data
DL as representation learning
How DL extracts hierarchical features from data
Good and bad news – the universal approximation theorem
How DL relates to ML and AI
Designing an NN
A simple feedforward neural network architecture
Key design choices
Hidden units and activation functions
Output units and cost functions
How to regularize deep NNs
Parameter norm penalties
Early stopping
Dropout
Training faster – optimizations for deep learning
Stochastic gradient descent
Momentum
Adaptive learning rates
Summary – how to tune key hyperparameters
A neural network from scratch in Python
The input layer
The hidden layer
The output layer
Forward propagation
The cross-entropy cost function
How to implement backprop using Python
How to compute the gradient
The loss function gradient
The output layer gradients
The hidden layer gradients
Putting it all together
Training the network
Popular deep learning libraries
Leveraging GPU acceleration
How to use TensorFlow 2
How to use TensorBoard
How to use PyTorch 1.4
How to create a PyTorch DataLoader
How to define the neural network architecture
How to train the model
How to evaluate the model predictions
Alternative options
Apache MXNet
Microsoft Cognitive Toolkit (CNTK)
Fastai
Optimizing an NN for a long-short strategy
Engineering features to predict daily stock returns
Defining an NN architecture framework
Cross-validating design options to tune the NN
Evaluating the predictive performance
Backtesting a strategy based on ensembled signals
Ensembling predictions to produce tradeable signals
Evaluating signal quality using Alphalens
Backtesting the strategy using Zipline
How to further improve the results
Summary
CNNs for Financial Time Series and Satellite Images
How CNNs learn to model grid-like data
From hand-coding to learning filters from data
How the elements of a convolutional layer operate
The convolution stage – extracting local features
The detector stage – adding nonlinearity
The pooling stage – downsampling the feature maps
The evolution of CNN architectures – key innovations
Performance breakthroughs and network size
Lessons learned
CNNs for satellite images and object detection
LeNet5 – The first CNN with industrial applications
“Hello World” for CNNs – handwritten digit classification
Defining the LeNet5 architecture
Training and evaluating the model
AlexNet – reigniting deep learning research
Preprocessing CIFAR-10 data using image augmentation
Defining the model architecture
Comparing AlexNet performance
Transfer learning – faster training with less data
Alternative approaches to transfer learning
Building on state-of-the-art architectures
Transfer learning with VGG16 in practice
Classifying satellite images with transfer learning
Object detection and segmentation
Object detection in practice
Preprocessing the source images
Transfer learning with a custom final layer
Creating a custom loss function and evaluation metrics
Fine-tuning the VGG16 weights and final layer
Lessons learned
CNNs for time-series data – predicting returns
An autoregressive CNN with 1D convolutions
Preprocessing the data
Defining the model architecture
Model training and performance evaluation
CNN-TA – clustering time series in 2D format
Creating technical indicators at different intervals
Computing rolling factor betas for different horizons
Features selecting based on mutual information
Hierarchical feature clustering
Creating and training a convolutional neural network
Assembling the best models to generate tradeable signals
Backtesting a long-short trading strategy
Summary and lessons learned
Summary
RNNs for Multivariate Time Series and Sentiment Analysis
How recurrent neural nets work
Unfolding a computational graph with cycles
Backpropagation through time
Alternative RNN architectures
Output recurrence and teacher forcing
Bidirectional RNNs
Encoder-decoder architectures, attention, and transformers
How to design deep RNNs
The challenge of learning long-range dependencies
Long short-term memory – learning how much to forget
Gated recurrent units
RNNs for time series with TensorFlow 2
Univariate regression – predicting the S&P 500
How to get time series data into shape for an RNN
How to define a two-layer RNN with a single LSTM layer
Training and evaluating the model
Re-scaling the predictions
Stacked LSTM – predicting price moves and returns
Preparing the data – how to create weekly stock returns
How to create multiple inputs in RNN format
How to define the architecture using Keras’ Functional API
Predicting returns instead of directional price moves
Multivariate time-series regression for macro data
Loading sentiment and industrial production data
Making the data stationary and adjusting the scale
Creating multivariate RNN inputs
Defining and training the model
RNNs for text data
LSTM with embeddings for sentiment classification
Loading the IMDB movie review data
Defining embedding and the RNN architecture
Sentiment analysis with pretrained word vectors
Preprocessing the text data
Loading the pretrained GloVe embeddings
Defining the architecture with frozen weights
Predicting returns from SEC filing embeddings
Source stock price data using yfinance
Preprocessing SEC filing data
Preparing data for the RNN model
Building, training, and evaluating the RNN model
Lessons learned and next steps
Summary
Autoencoders for Conditional Risk Factors and Asset Pricing
Autoencoders for nonlinear feature extraction
Generalizing linear dimensionality reduction
Convolutional autoencoders for image compression
Managing overfitting with regularized autoencoders
Fixing corrupted data with denoising autoencoders
Seq2seq autoencoders for time series features
Generative modeling with variational autoencoders
Implementing autoencoders with TensorFlow 2
How to prepare the data
One-layer feedforward autoencoder
Defining the encoder
Defining the decoder
Training the model
Evaluating the results
Feedforward autoencoder with sparsity constraints
Deep feedforward autoencoder
Visualizing the encoding
Convolutional autoencoders
Denoising autoencoders
A conditional autoencoder for trading
Sourcing stock prices and metadata information
Computing predictive asset characteristics
Creating the conditional autoencoder architecture
Lessons learned and next steps
Summary
Generative Adversarial Networks for Synthetic Time-Series Data
Creating synthetic data with GANs
Comparing generative and discriminative models
Adversarial training – a zero-sum game of trickery
The rapid evolution of the GAN architecture zoo
Deep convolutional GANs for representation learning
Conditional GANs for image-to-image translation
GAN applications to images and time-series data
CycleGAN – unpaired image-to-image translation
StackGAN – text-to-photo image synthesis
SRGAN – photorealistic single image super-resolution
Synthetic time series with recurrent conditional GANs
How to build a GAN using TensorFlow 2
Building the generator network
Creating the discriminator network
Setting up the adversarial training process
Defining the generator and discriminator loss functions
The core – designing the training step
Putting it together – the training loop
Evaluating the results
TimeGAN for synthetic financial data
Learning to generate data across features and time
Combining adversarial and supervised training
The four components of the TimeGAN architecture
Joint training of an autoencoder and adversarial network
Implementing TimeGAN using TensorFlow 2
Preparing the real and random input series
Creating the TimeGAN model components
Training phase 1 – autoencoder with real data
Training phase 2 – supervised learning with real data
Training phase 3 – joint training with real and random data
Generating synthetic time series
Evaluating the quality of synthetic time-series data
Assessing diversity – visualization using PCA and t-SNE
Assessing fidelity – time-series classification performance
Assessing usefulness – train on synthetic, test on real
Lessons learned and next steps
Summary
Deep Reinforcement Learning – Building a Trading Agent
Elements of a reinforcement learning system
The policy – translating states into actions
Rewards – learning from actions
The value function – optimal choice for the long run
With or without a model – look before you leap?
How to solve reinforcement learning problems
Key challenges in solving RL problems
Credit assignment
Exploration versus exploitation
Fundamental approaches to solving RL problems
Solving dynamic programming problems
Finite Markov decision problems
Sequences of states, actions, and rewards
Value functions – how to estimate the long-run reward
The Bellman equations
From a value function to an optimal policy
Policy iteration
Value iteration
Generalized policy iteration
Dynamic programming in Python
Setting up the gridworld
Computing the transition matrix
Implementing the value iteration algorithm
Defining and running policy iteration
Solving MDPs using pymdptoolbox
Lessons learned
Q-learning – finding an optimal policy on the go
Exploration versus exploitation – ε-greedy policy
The Q-learning algorithm
How to train a Q-learning agent using Python
Deep RL for trading with the OpenAI Gym
Value function approximation with neural networks
The Deep Q-learning algorithm and extensions
(Prioritized) Experience replay – focusing on past mistakes
The target network – decorrelating the learning process
Double deep Q-learning – decoupling action and prediction
Introducing the OpenAI Gym
How to implement DDQN using TensorFlow 2
Creating the DDQN agent
Adapting the DDQN architecture to the Lunar Lander
Memorizing transitions and replaying the experience
Setting up the OpenAI environment
Key hyperparameter choices
Lunar Lander learning performance
Creating a simple trading agent
How to design a custom OpenAI trading environment
Designing a DataSource class
The TradingSimulator class
The TradingEnvironment class
Registering and parameterizing the custom environment
Deep Q-learning on the stock market
Adapting and training the DDQN agent
Benchmarking DDQN agent performance
Lessons learned
Summary
Conclusions and Next Steps
Key takeaways and lessons learned
Data is the single most important ingredient
The new oil? Quality control for raw and intermediate data
Data integration – the whole exceeds the sum of its parts
Domain expertise – telling the signal from the noise
ML is a toolkit for solving problems with data
Model diagnostics help speed up optimization
Making do without a free lunch
Managing the bias-variance trade-off
Defining targeted model objectives
The optimization verification test
Beware of backtest overfitting
How to gain insights from black-box models
ML for trading in practice
Data management technologies
Database systems
Big data technologies – from Hadoop to Spark
ML tools
Online trading platforms
Quantopian
QuantConnect
QuantRocket
Conclusion
Appendix: Alpha Factor Library
Common alpha factors implemented in TA-Lib
A key building block – moving averages
Simple moving average
Exponential moving average
Weighted moving average
Double exponential moving average
Triple exponential moving average
Triangular moving average
Kaufman adaptive moving average
MESA adaptive moving average
Visual comparison of moving averages
Overlap studies – price and volatility trends
Bollinger Bands
Parabolic SAR
Momentum indicators
Average directional movement indicators
Aroon Oscillator
Balance of power
Commodity channel index
Moving average convergence divergence
Stochastic relative strength index
Stochastic oscillator
Ultimate oscillator
Volume and liquidity indicators
Chaikin accumulation/distribution line and oscillator
On-balance volume
Volatility indicators
Average true range
Normalized average true range
Fundamental risk factors
WorldQuant’s quest for formulaic alphas
Cross-sectional and time-series functions
Formulaic alpha expressions
Alpha 001
Alpha 054
Bivariate and multivariate factor evaluation
Information coefficient and mutual information
Feature importance and SHAP values
Comparison – the top 25 features for each metric
Financial performance – Alphalens
References
Index
Stefan Jansen is the founder and CEO of Applied AI. He advises Fortune 500 companies, investment firms, and startups across industries on data & AI strategy, building data science teams, and developing end-to-end machine learning solutions for a broad range of business problems.
Before his current venture, he was a partner and managing director at an international investment firm, where he built the predictive analytics and investment research practice. He was also a senior executive at a global fintech company with operations in 15 markets, advised Central Banks in emerging markets, and consulted for the World Bank.
He holds Master’s degrees in Computer Science from Georgia Tech and in Economics from Harvard and Free University Berlin, and a CFA Charter. He has worked in six languages across Europe, Asia, and the Americas and taught data science at Datacamp and General Assembly.
What makes us different?
• Instant Download
• Always Competitive Pricing
• 100% Privacy
• FREE Sample Available
• 24-7 LIVE Customer Support

