Description
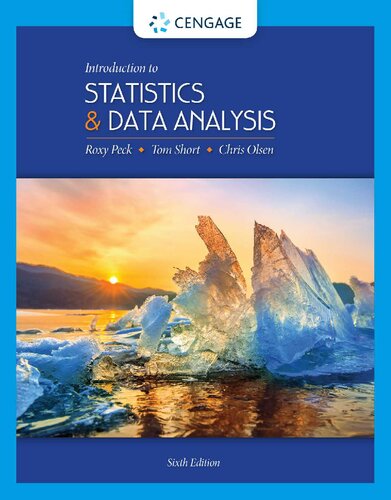
Introduction to Statistics and Data Analysis 6th Edition by Roxy Peck, ISBN-13: 978-1337793612
[PDF eBook eTextbook]
- Publisher: Cengage Learning; 6th edition (January 1, 2019)
- Language: English
- 896 pages
- ISBN-10: 1337793612
- ISBN-13: 978-1337793612
Peck, Short, and Olsen’s INTRODUCTION TO STATISTICS AND DATA ANALYSIS, 6th Edition stresses interpretation and communication of statistical information through hands-on, activity based learning using real data in order to get you thinking statistically. This 6th Edition contains new sections on randomization-based inference: bootstrap methods for simulation-based confidence intervals and randomization tests of hypotheses. These new sections are accompanied by online Shiny apps, which can be used to construct bootstrap confidence intervals and to carry out randomization tests. In addition, a new visualization tool at statistics.cengage.com will help you understand these new concepts.
Table of Contents:
Author Bios
Brief Contents
Contents
Preface
Chapter 1: The Role of Statistics and the Data Analysis Process
1.1 Why Study Statistics?
1.2 The Nature and Role of Variability
1.3 Statistics and the Data Analysis Process
1.4 Types of Data and Some Simple Graphical Displays
Activity 1.1 Head Sizes: Understanding Variability
Activity 1.2 Estimating Shape Sizes
Activity 1.3 A Meaningful Paragraph
Summary: Key Concepts and Formulas
Chapter Review
Technology Notes
Chapter 2: Collecting Data Sensibly
2.1 Statistical Studies: Observation and Experimentation
2.2 Sampling
2.3 Simple Comparative Experiments
2.4 More on Experimental Design
2.5 Interpreting and Communicating the Results of Statistical Analyses
Activity 2.1 Facebook Friending
Activity 2.2 An Experiment to Test for the Stroop Effect
Activity 2.3 McDonald’s and the Next 100 Billion Burgers
Activity 2.4 Video Games and Pain Management
Activity 2.5 Be Careful with Random Assignment!
Summary: Key Concepts and Formulas
Chapter Review
Technology Notes
Chapter 3: Graphical Methods for Describing Data
3.1 Displaying Categorical Data: Comparative Bar Charts and Pie Charts
3.2 Displaying Numerical Data: Stem-and-Leaf Displays
3.3 Displaying Numerical Data: Frequency Distributions and Histograms
3.4 Displaying Bivariate Numerical
3.5 Interpreting and Communicating the Results of Statistical Analyses
Activity 3.1 Locating States
Activity 3.2 Bean Counters!
Summary: Key Concepts and Formulas
Chapter Review
Technology Notes
Cumulative Review Exercises
Chapter 4: Numerical Methods for Describing Data
4.1 Describing the Center of a Data Set
4.2 Describing Variability in a Data Set
4.3 Summarizing a Data Set: Boxplots
4.4 Interpreting Center and Variability: Chebyshev’s Rule, the Empirical Rule, and z Scores
4.5 Interpreting and Communicating the Results of Statistical Analyses
Activity 4.1 Collecting and Summarizing Numerical Data
Activity 4.2 Airline Passenger Weights
Activity 4.3 Boxplot Shapes
Summary: Key Concepts and Formulas
Chapter Review
Technology Notes
Chapter 5: Summarizing Bivariate Data
5.1 Correlation
5.2 Linear Regression: Fitting a Line to Bivariate Data
5.3 Assessing the Fit of a Line
5.4 Nonlinear Relationships and Transformations
5.5 Interpreting and Communicating the Results of Statistical Analyses
Activity 5.1 Age and Flexibility
Summary: Key Concepts and Formulas
Chapter Review
Technology Notes
Cumulative Review Exercises
Chapter 6: Probability
6.1 Chance Experiments and Events
6.2 Definition of Probability
6.3 Basic Properties of Probability
6.4 Conditional Probability
6.5 Independence
6.6 Some General Probability Rules
6.7 Estimating Probabilities Empirically and Using Simulation
Activity 6.1 Kisses
Activity 6.2 A Crisis for European Sports Fans?
Activity 6.3 The “Hot Hand” in Basketball
Summary: Key Concepts and Formulas
Chapter Review
Chapter 7: Random Variables and Probability Distributions
7.1 Random Variables
7.2 Probability Distributions for Discrete Random Variables
7.3 Probability Distributions for Continuous Random Variables
7.4 Mean and Standard Deviation of a Random Variable
7.5 Binomial and Geometric Distributions
7.6 Normal Distributions
7.7 Checking for Normality and Normalizing Transformations
7.8 Using the Normal Distribution to Approximate a Discrete Distribution (Optional)
Activity 7.1 Is It Real?
Activity 7.2 Rotten Eggs?
Summary: Key Concepts and Formulas
Chapter Review
Technology Notes
Cumulative Review Exercises
Chapter 8: Sampling Variability and Sampling Distributions
8.1 Statistics and Sampling Variability
8.2 The Sampling Distribution of a Sample Mean
8.3 The Sampling Distribution of a Sample Proportion
Activity 8.1 Sampling Distribution of the Sample Mean
Activity 8.2 Sampling Distribution of the Sample Proportion
Activity 8.3 Do Students Who Take the SATs Multiple Times Have an Advantage in College Admissions?
Summary: Key Concepts and Formulas
Chapter Review
Chapter 9: Estimation Using a Single Sample
9.1 Point Estimation
9.2 Large-Sample Confidence Interval for a Population Proportion
9.3 Confidence Interval for a Population Mean
9.4 Interpreting and Communicating the Results of Statistical Analyses
9.5 Bootstrap Confidence Intervals for a Population Proportion (Optional)
9.6 Bootstrap Confidence Intervals for a Population Mean (Optional)
Activity 9.1 Getting a Feel for Confidence Level
Activity 9.2 An Alternative Confidence Interval for a Population Proportion
Activity 9.3 Verifying Signatures on a Recall Petition
Activity 9.4 A Meaningful Paragraph
Summary: Key Concepts and Formulas
Chapter Review
Technology Notes
Chapter 10: Hypothesis Testing Using a Single Sample
10.1 Hypotheses and Test Procedures
10.2 Errors in Hypothesis Testing
10.3 Large-Sample Hypothesis Tests for a Population Proportion
10.4 Hypothesis Tests for a Population Mean
10.5 Power and Probability of Type II Error
10.6 Interpreting and Communicating the Results of Statistical Analyses
10.7 Randomization Test and Exact Binomial Test for a Population Proportion (Optional)
10.8 Randomization Test for a Population Mean (Optional)
Activity 10.1 Comparing the t and z Distributions
Activity 10.2 A Meaningful Paragraph
Summary: Key Concepts and Formulas
Chapter Review
Technology Notes
Cumulative Review Exercises
Chapter 11: Comparing Two Populations or Treatments
11.1 Inferences Concerning the Difference between Two Population or Treatment Means Using Independen
11.2 Inferences Concerning the Difference between Two Population or Treatment Means Using Paired Sam
11.3 Large-Sample Inferences Concerning the Difference between Two Population or Treatment Proportio
11.4 Interpreting and Communicating the Results of Statistical Analyses
11.5 Simulation-Based Inference for Two Means (Optional)
11.6 Simulation-Based Inference for Two Proportions (Optional)
Activity 11.1 Helium-Filled Footballs?
Activity 11.2 Thinking about Data Collection
Activity 11.3 A Meaningful Paragraph
Summary: Key Concepts and Formulas
Chapter Review
Technology Notes
Chapter 12: The Analysis of Categorical Data and Goodness-of-Fit Tests
12.1 Chi-Square Tests for Univariate Data
12.2 Tests for Homogeneity and Independence in a Two-Way Table
12.3 Interpreting and Communicating the Results of Statistical Analyses
Activity 12.1 Pick a Number, Any Number . . .
Activity 12.2 Color and Perceived Taste
Summary: Key Concepts and Formulas
Chapter Review
Technology Notes
Chapter 13: Simple Linear Regression and Correlation: Inferential Methods
13.1 Simple Linear Regression Model
13.2 Inferences About the Slope of the Population Regression Line
13.3 Checking Model Adequacy
Activity 13.1 Are Tall Women from “Big” Families?
Summary: Key Concepts and Formulas
Technology Notes
Cumulative Review Exercises
Chapter 14: Multiple Regression Analysis
14.1 Multiple Regression Models
14.2 Fitting a Model and Assessing Its Utility
Activity 14.1 Exploring the Relationship between Number of Predictors and Sample Size
Summary: Key Concepts and Formulas
Chapter 15: Analysis of Variance
15.1 Single-Factor ANOVA and the F Test
15.2 Multiple Comparisons
Activity 15.1 Exploring Single-Factor ANOVA
Summary: Key Concepts and Formulas
Technology Notes
Appendix: Statistical Tables
Answers to Selected Odd-Numbered Exercises
Index
Roxy Peck is emerita associate dean of the College of Science and Mathematics and professor of statistics emerita at California Polytechnic State University, San Luis Obispo. A faculty member at Cal Poly from 1979 until 2009, Dr. Peck served for six years as chair of the statistics department before becoming associate dean, a position she held for 13 years. She received an M.S. in mathematics and a Ph.D. in applied statistics from the University of California, Riverside. Dr. Peck is nationally known in the area of statistics education, and she was presented with the Lifetime Achievement Award in Statistics Education at the U.S. Conference on Teaching Statistics in 2009. In 2003, she received the American Statistical Association’s Founder’s Award, recognizing her contributions to K-12 and undergraduate statistics education. She is a fellow of the American Statistical Association and an elected member of the International Statistics Institute. Dr. Peck served for five years as the chief reader for the Advanced Placement (AP) Statistics Exam and has chaired the American Statistical Association’s Joint Committee with the National Council of Teachers of Mathematics on Curriculum in Statistics and Probability for Grades K-12 and the Section on Statistics Education. In addition to her texts in introductory statistics, Dr. Peck is co-editor of STATISTICAL CASE STUDIES: A COLLABORATION BETWEEN ACADEME AND INDUSTRY and is a member of the editorial board for STATISTICS: A GUIDE TO THE UNKNOWN, 4TH EDITION. Outside of the classroom, she likes to travel and spends her spare time reading mystery novels. Dr. Peck also collects Navajo rugs and heads to Arizona and New Mexico whenever she can find the time.
Chris Olsen taught statistics at George Washington High School in Cedar Rapids, Iowa, for over 25 years and currently teaches at Grinnell College. Chris is a past member (twice) of the AP Statistics Test Development Committee and has been a table leader at the AP Statistics reading for 14 years. He is a long-time consultant to the College Board and has led workshops and institutes for AP Statistics teachers in the United States and internationally. Chris was the Iowa recipient of the Presidential Award for Excellence in Science and Mathematics Teaching in 1986, a regional awardee of the IBM Computer Teacher of the Year in 1988, and received the Siemens Award for Advanced Placement in Mathematics in 1999. Chris is a frequent contributor to and is moderator of the AP Teacher Community online. He is currently a member of the editorial board of “Teaching Statistics.” Chris graduated from Iowa State University with a major in mathematics and philosophy, and while acquiring graduate degrees at the University of Iowa, he concentrated on statistics, computer programming, and psychometrics. In his spare time he enjoys reading and hiking. He and his wife have a daughter, Anna, a Caltech graduate in Civil Engineering.
The late Tom Short was an Associate Professor in the Statistics Program within the Department of Mathematics at West Chester University of Pennsylvania. He also previously held faculty positions at Villanova University, Indiana University of Pennsylvania and John Carroll University. He was a Fellow of the American Statistical Association and received the 2005 Mu Sigma Rho Statistics Education Award. Tom served on the leadership team for readings of the Advanced Placement (AP) Statistics Exam, and on the AP Statistics Development Committee. He also served on the Board of Directors of the American Statistical Association. Tom treasured the time he shared with his four children and the many adventures experienced with his wife, Darlene.
What makes us different?
• Instant Download
• Always Competitive Pricing
• 100% Privacy
• FREE Sample Available
• 24-7 LIVE Customer Support


