Description
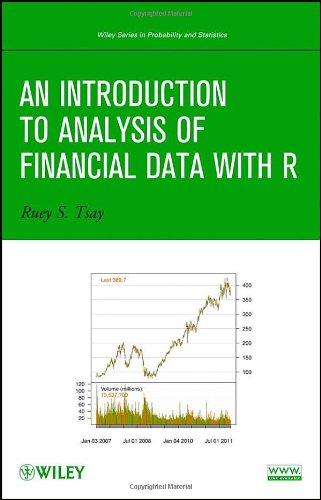
An Introduction to Analysis of Financial Data with R, ISBN-13: 978-0470890813
[PDF eBook eTextbook] – Available Instantly
- Publisher: Wiley; 1st edition (October 16, 2012)
- Language: English
- 414 pages
- ISBN-10: 0470890819
- ISBN-13: 978-0470890813
A complete set of statistical tools for beginning financial analysts from a leading authority.
Written by one of the leading experts on the topic, An Introduction to Analysis of Financial Data with R explores basic concepts of visualization of financial data. Through a fundamental balance between theory and applications, the book supplies readers with an accessible approach to financial econometric models and their applications to real-world empirical research.
The author supplies a hands-on introduction to the analysis of financial data using the freely available R software package and case studies to illustrate actual implementations of the discussed methods. The book begins with the basics of financial data, discussing their summary statistics and related visualization methods. Subsequent chapters explore basic time series analysis and simple econometric models for business, finance, and economics as well as related topics including:
- Linear time series analysis, with coverage of exponential smoothing for forecasting and methods for model comparison
- Different approaches to calculating asset volatility and various volatility models
- High-frequency financial data and simple models for price changes, trading intensity, and realized volatility
- Quantitative methods for risk management, including value at risk and conditional value at risk
- Econometric and statistical methods for risk assessment based on extreme value theory and quantile regression
Throughout the book, the visual nature of the topic is showcased through graphical representations in R, and two detailed case studies demonstrate the relevance of statistics in finance. A related website features additional data sets and R scripts so readers can create their own simulations and test their comprehension of the presented techniques.
An Introduction to Analysis of Financial Data with R is an excellent book for introductory courses on time series and business statistics at the upper-undergraduate and graduate level. The book is also an excellent resource for researchers and practitioners in the fields of business, finance, and economics who would like to enhance their understanding of financial data and today’s financial markets.
Table of Contents:
Title Page
Copyright Page
CONTENTS
Preface
1 FINANCIAL DATA AND THEIR PROPERTIES
1.1 Asset Returns
1.2 Bond Yields and Prices
1.3 Implied Volatility
1.4 R Packages and Demonstrations
1.4.1 Installation of R Packages
1.4.2 The Quantmod Package
1.4.3 Some Basic R Commands
1.5 Examples of Financial Data
1.6 Distributional Properties of Returns
1.6.1 Review of Statistical Distributions and Their Moments
1.7 Visualization of Financial Data
1.8 Some Statistical Distributions
1.8.1 Normal Distribution
1.8.2 Lognormal Distribution
1.8.3 Stable Distribution
1.8.4 Scale Mixture of Normal Distributions
1.8.5 Multivariate Returns
Exercises
References
2 LINEAR MODELS FOR FINANCIAL TIME SERIES
2.1 Stationarity
2.2 Correlation and Autocorrelation Function
2.3 White Noise and Linear Time Series
2.4 Simple Autoregressive Models
2.4.1 Properties of AR Models
2.4.2 Identifying AR Models in Practice
2.4.3 Goodness of Fit
2.4.4 Forecasting
2.5 Simple Moving Average Models
2.5.1 Properties of MA Models
2.5.2 Identifying MA Order
2.5.3 Estimation
2.5.4 Forecasting Using MA Models
2.6 Simple ARMA Models
2.6.1 Properties of ARMA(1,1) Models
2.6.2 General ARMA Models
2.6.3 Identifying ARMA Models
2.6.4 Forecasting Using an ARMA Model
2.6.5 Three Model Representations for an ARMA Model
2.7 Unit-Root Nonstationarity
2.7.1 Random Walk
2.7.2 Random Walk with Drift
2.7.3 Trend-Stationary Time Series
2.7.4 General Unit-Root Nonstationary Models
2.7.5 Unit-Root Test
2.8 Exponential Smoothing
2.9 Seasonal Models
2.9.1 Seasonal Differencing
2.9.2 Multiplicative Seasonal Models
2.9.3 Seasonal Dummy Variable
2.10 Regression Models with Time Series Errors
2.11 Long-Memory Models
2.12 Model Comparison and Averaging
2.12.1 In-sample Comparison
2.12.2 Out-of-sample Comparison
2.12.3 Model Averaging
Exercises
References
3 CASE STUDIES OF LINEAR TIME SERIES
3.1 Weekly Regular Gasoline Price
3.1.1 Pure Time Series Model
3.1.2 Use of Crude Oil Prices
3.1.3 Use of Lagged Crude Oil Prices
3.1.4 Out-of-Sample Predictions
3.2 Global Temperature Anomalies
3.2.1 Unit-Root Stationarity
3.2.2 Trend-Nonstationarity
3.2.3 Model Comparison
3.2.4 Long-Term Prediction
3.2.5 Discussion
3.3 US Monthly Unemployment Rates
3.3.1 Univariate Time Series Models
3.3.2 An Alternative Model
3.3.3 Model Comparison
3.3.4 Use of Initial Jobless Claims
3.3.5 Comparison
Exercises
References
4 ASSET VOLATILITY AND VOLATILITY MODELS
4.1 Characteristics of Volatility
4.2 Structure of a Model
4.3 Model Building
4.4 Testing for ARCH Effect
4.5 The ARCH Model
4.5.1 Properties of ARCH Models
4.5.2 Advantages and Weaknesses of ARCH Models
4.5.3 Building an ARCH Model
4.5.4 Some Examples
4.6 The GARCH Model
4.6.1 An Illustrative Example
4.6.2 Forecasting Evaluation
4.6.3 A Two-Pass Estimation Method
4.7 The Integrated GARCH Model
4.8 The GARCH-M Model
4.9 The Exponential Garch Model
4.9.1 An Illustrative Example
4.9.2 An Alternative Model Form
4.9.3 Second Example
4.9.4 Forecasting Using an EGARCH Model
4.10 The Threshold Garch Model
4.11 Asymmetric Power ARCH Models
4.12 Nonsymmetric GARCH Model
4.13 The Stochastic Volatility Model
4.14 Long-Memory Stochastic Volatility Models
4.15 Alternative Approaches
4.15.1 Use of High Frequency Data
4.15.2 Use of Daily Open, High, Low, and Close Prices
Exercises
References
5 APPLICATIONS OF VOLATILITY MODELS
5.1 Garch Volatility Term Structure
5.1.1 Term Structure
5.2 Option Pricing and Hedging
5.3 Time-Varying Correlations and Betas
5.3.1 Time-Varying Betas
5.4 Minimum Variance Portfolios
5.5 Prediction
Exercises
References
6 HIGH FREQUENCY FINANCIAL DATA
6.1 Nonsynchronous Trading
6.2 Bid–Ask Spread of Trading Prices
6.3 Empirical Characteristics of Trading Data
6.4 Models for Price Changes
6.4.1 Ordered Probit Model
6.4.2 A Decomposition Model
6.5 Duration Models
6.5.1 Diurnal Component
6.5.2 The ACD Model
6.5.3 Estimation
6.6 Realized Volatility
6.6.1 Handling Microstructure Noises
6.6.2 Discussion
Appendix A: Some Probability Distributions
Appendix B: Hazard Function
Exercises
References
7 VALUE AT RISK
7.1 Risk Measure and Coherence
7.1.1 Value at Risk (VaR)
7.1.2 Expected Shortfall
7.2 Remarks on Calculating Risk Measures
7.3 Riskmetrics
7.3.1 Discussion
7.3.2 Multiple Positions
7.4 An Econometric Approach
7.4.1 Multiple Periods
7.5 Quantile Estimation
7.5.1 Quantile and Order Statistics
7.5.2 Quantile Regression
7.6 Extreme Value Theory
7.6.1 Review of Extreme Value Theory
7.6.2 Empirical Estimation
7.6.3 Application to Stock Returns
7.7 An Extreme Value Approach to Var
7.7.1 Discussion
7.7.2 Multiperiod VaR
7.7.3 Return Level
7.8 Peaks Over Thresholds
7.8.1 Statistical Theory
7.8.2 Mean Excess Function
7.8.3 Estimation
7.8.4 An Alternative Parameterization
7.9 The Stationary Loss Processes
Exercises
References
Index
What makes us different?
• Instant Download
• Always Competitive Pricing
• 100% Privacy
• FREE Sample Available
• 24-7 LIVE Customer Support


